
The new La Masia is very different from the old. After the move out from the centre of the city 10 years ago, the traditional farmhouse has been replaced by a modern office block. And as Javier Fernandez, data scientist for FC Barcelona, showed me round the corridors of the new centre, it felt that I could be in the high-tech headquarters of Google or a world-renowned University department. It was easy to forget that, at the very same time as this tour was taking place, only a few hundred meters away, Messi and company training in preparation for the coming season.
The tour completed, we got straight down to the doing Science. That was what I was really here for. Javier and other members of his team are leading a rigorous scientific attempt to understand football. The focus is on looking at the data created by football players as honestly and rigorously as possible.
Javier sees football data more clearly than most. A few months before my first visit to Barcelona in August 2018, he published a paper, together with Luke Bornn of the basketball team the Sacramento Kings, about how Barcelona control space. The key idea behind their work is breathtakingly simple. Javier’s method involves painting the pitch a colour that reflects who will get to the ball first. Areas painted green are controlled by Barcelona, areas painted red are controlled by the opposition, as in the picture below.
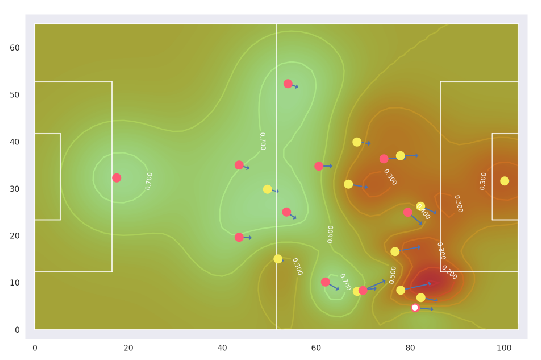
A well-functioning Barcelona team ‘paints’ a lot of the pitch green, indicating that they control the largest area. They use possession of the ball to open up space for attack. This is one of the basic principles of play that permeates the philosophy of the club. Javier and his colleagues have found a way of measuring how the team he works for have implemented this principle.
The idea is simple, but it is a view of football that is very different from that which many of us have. Instead of a narrow focus on the ball, on passes and shots or a wider, but more abstract tactical focus on formations (such as 4-3-3 or 4-2-3-1), the concept of pitch control is a concrete way of measuring the off-the-ball movement of the team that can be applied in almost any situation. When we hear TV studio pundits talk about how a player should have made this run or played this pass, they are seldom considering how the players work together as a team to create space for each other long before the ball comes to them. They are instead critiquing individual decisions. At Barcelona, from the academy to the A-team, the focus is on getting the overall structure right. With a good collaborative structure on the field, the correct decisions come intuitively.
Pitch control has its roots in mathematics that is over 100 years old. In my book Soccermatics, I looked at a technique known as the Voronoi diagram which divides the pitch into zones, where each zone is the points closest to a particular player. When I was applying this method to football I used footage of Barcelona 2010-11 as my test data set. The choice was deliberate on my part. That team was football at its mathematical perfection, and the key example I gave, was a goal by Messi in the Champions League against Panathinaikos. The diagrams below show the position of the team just before Messi plays a one-two with Xavi.
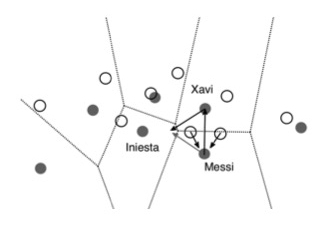
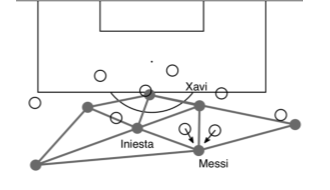
The first picture is the Voronoi diagram showing which player controls which zone. Xavi, Iniesta and Messi, in black, have positioned themselves so that the Panathinaikos’ defenders are on the edges of the diagram. As a result, as is shown in the second figure, they open up triangular passing alternatives.
In maths, this idea is known as a duality. The problem of dividing up the pitch into sections based on who is closest to each point is equivalent, or dual, to finding the triangles connecting neighbouring players. Maths tells us that creating space automatically provides passing alternatives. Barcelona’s game is built on this geometric duality. The Tiki-taka triangles of the 2010-11 team emerged from the way Pep had his team move to open up space.
So here I am now grilling Javier on the details of his work. For me, as a mathematician, I want to know how far we can push the idea of pitch control. Javier explained that a concept like pitch control only becomes useful for describing a team’s attack when we consider it in the context of how the opposition defends. “When we analyse space creation, we first need to automatically identify the three defensive lines of the team”, he told me.
In footballing terms, these are best thought of as the lines created by the opposition’s 4-4-2 formation, for example. When playing out from the back, starting from the goalkeeper, Barcelona must first get the ball past the oppositions’ two forwards, who press the defenders as they try to find an opening. Then they must progress through the four midfielders, before finally getting past the last line of defence in the form of the last four defenders. In the example above, Messi’s wall-pass with Xavi took him through the second of these lines, past the midfield line.
While it might be reasonably obvious to a human observer where the three defensive lines lie, it is not a trivial task to get a computer to automatically detect these lines. This is where Javier’s skills, PhD candidate in AI comes in. He has developed an algorithm which works out how the oppositions defensive lines are structured and when a team has passed from one line to the next.
“Once we can automatically detect the lines of defensive pressure, we can analyse several other things, such as how much of the pitch we control at the moment a pass is attempted between the lines.”, Javier told me, “We can even look at how pitch control changes in time and whether a pass came at the point the team-best controlled the area between the lines.”
I ask Javier how long it will be until the coaches are using his tools in their everyday work. He shows me the tool which he and his colleagues that automatically identifies sequences in the game: counter-attacks, possession-based attacks, set-pieces and so on. This allows tactical analysts to quickly get the most relevant clips and better organize their analysis.
But there are still a few hurdles to be overcome before the coaches are using mathematical concepts, such as pitch control, when they analyse a match. “When I listened more closely to how coaches talked about controlling space, they always implicitly mean a place of value. So even if a team is gaining pitch control by our measurement, they don’t call it space creation unless that space has value to the team.”
This has led Javier and his team to develop their next tool, called Expected Possession Value (EPV), a concept taken from basketball. I will look at this more closely in a future article.
Javier told me, “Each development is part of an ongoing discussion about how we can best integrate this type of analytics in coaching.”
There are three themes that underlie modern football analytics and form the basis for how Javier and I discuss research. The first theme is mathematics and geometry. My previous research has looked at how animal groups move together. Javier asked me how we create our models of bird flocks and fish schools, what rules these species use to interact and how we might find similar simple rules for football. This is a question we and others are currently working on: can we simulate a football match using similar methods to those applied in animal movement?
The second theme is the importance of data science and visualization. It isn’t enough to work with statistics, even advanced stats such as expected goals. We need to have tools which show how a team plays together, that automatically identifies different match situations and proposes solutions to the coaches. This is where modern machine learning comes in. Automated analysis of the match, combined with human insight, will help coaches improve their own team and prepare for the opposition.
The third theme is the most important: putting theory into practice. The most exciting possibility, as I see it, is showing players how their movement breaks down defensive lines. Going over decisions made during the match: Should I have passed or shot? Should I have made an overlapping run or a run into the box? These are questions a player can answer for themselves using tools based on data.
In this series of articles, I am going to look at how these three themes are interacting to change the modern game. I will be going deep into the research done both at the Barcelona Innovation Hub and elsewhere. I will talk to the experts who are coupling together geometry, data science and footballing knowledge to provide a new form of football analytics.
It is here that the football data revolution will start to take form.
David Sumpter
Further reading:
Fernandez, Javier, F. Barcelona, and Luke Bornn. “Wide Open Spaces: A statistical technique for measuring space creation in professional soccer.” In Proceedings of the 12th Annual MIT Sloan Sports Analytics Conference. 2018.
Sumpter, David. Soccermatics: mathematical adventures in the beautiful game. Bloomsbury Publishing, 2016.
Bornn, Luke, Dan Cervone, and Javier Fernandez. “Soccer analytics: Unravelling the complexity of “the beautiful game”.” Significance 15, no. 3 (2018): 26-29.
Sign up for the Certificate in Football Tactical Analyst
KNOW MORE
CATEGORY: MARKETING, COMMUNICATION AND MANAGEMENT
This model looks to the future with the requirements and demands of a new era of stadiums, directed toward improving and fulfilling the experiences of fans and spectators, remembering “feeling” and “passion” when designing their business model.
CATEGORY: FOOTBALL SPORTS PERFORMANCE
Through the use of computer vision we can identify some shortcomings in the body orientation of players in different game situations.
CATEGORY: MEDICINE HEALTH AND WELLNESS
A health check must detect situations which, despite not showing obvious symptoms, may endanger athletes subject to the highest demands.
CATEGORY: FOOTBALL TEAM SPORTS
In the words of Johan Cruyff, “Players, in reality, have the ball for 3 minutes, on average. So, the most important thing is: what do you do during those 87 minutes when you do not have the ball? That is what determines whether you’re a good player or not.”
CATEGORY: MEDICINE HEALTH AND WELLNESS SPORTS PERFORMANCE
Muscle injuries account for more than 30% of all injuries in sports like soccer. Their significance is therefore enormous in terms of training sessions and lost game time.
DO YOU WANT TO KNOW MORE?
- SUBSCRIBE
- CONTACT
- APPLY
KEEP UP TO DATE WITH OUR NEWS
Do you have any questions about Barça Universitas?
- Startup
- Research Center
- Corporate